Cashington
Guides Every month
Read Insights and drill down
What you'll do
Insights shows where the money comes from and where it goes, over 1, 3, 12 or 24 months, or everything you have. Two rings open the page, then the Money map, then a box each for where the money comes from, your recurring bills and your spending lines. Its figures agree with Cash Flow for the same months, and every band, bar and line opens the rows behind it.
Updated October 2026 · Cashington 0.2.8 · 10 steps · screenshots show an invented household
-
Pick a range
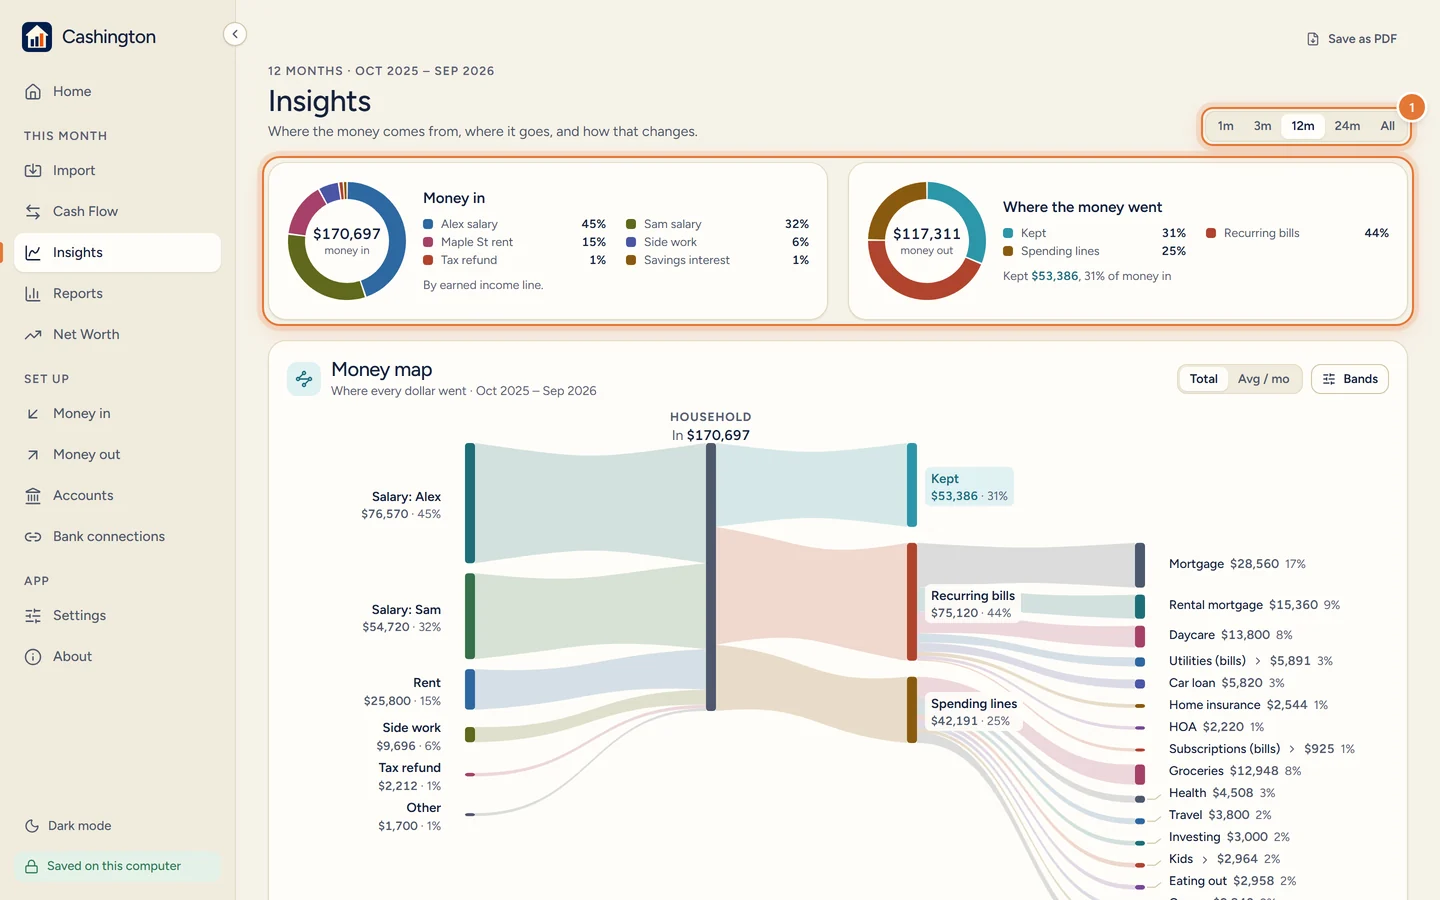
Open Insights and pick a range: 1, 3, 12 or 24 months, or All. Two rings open the page: Money in, by income line, with the total in the middle, and Where the money went, with what you kept and its share of the money in.
-
Read the Money map
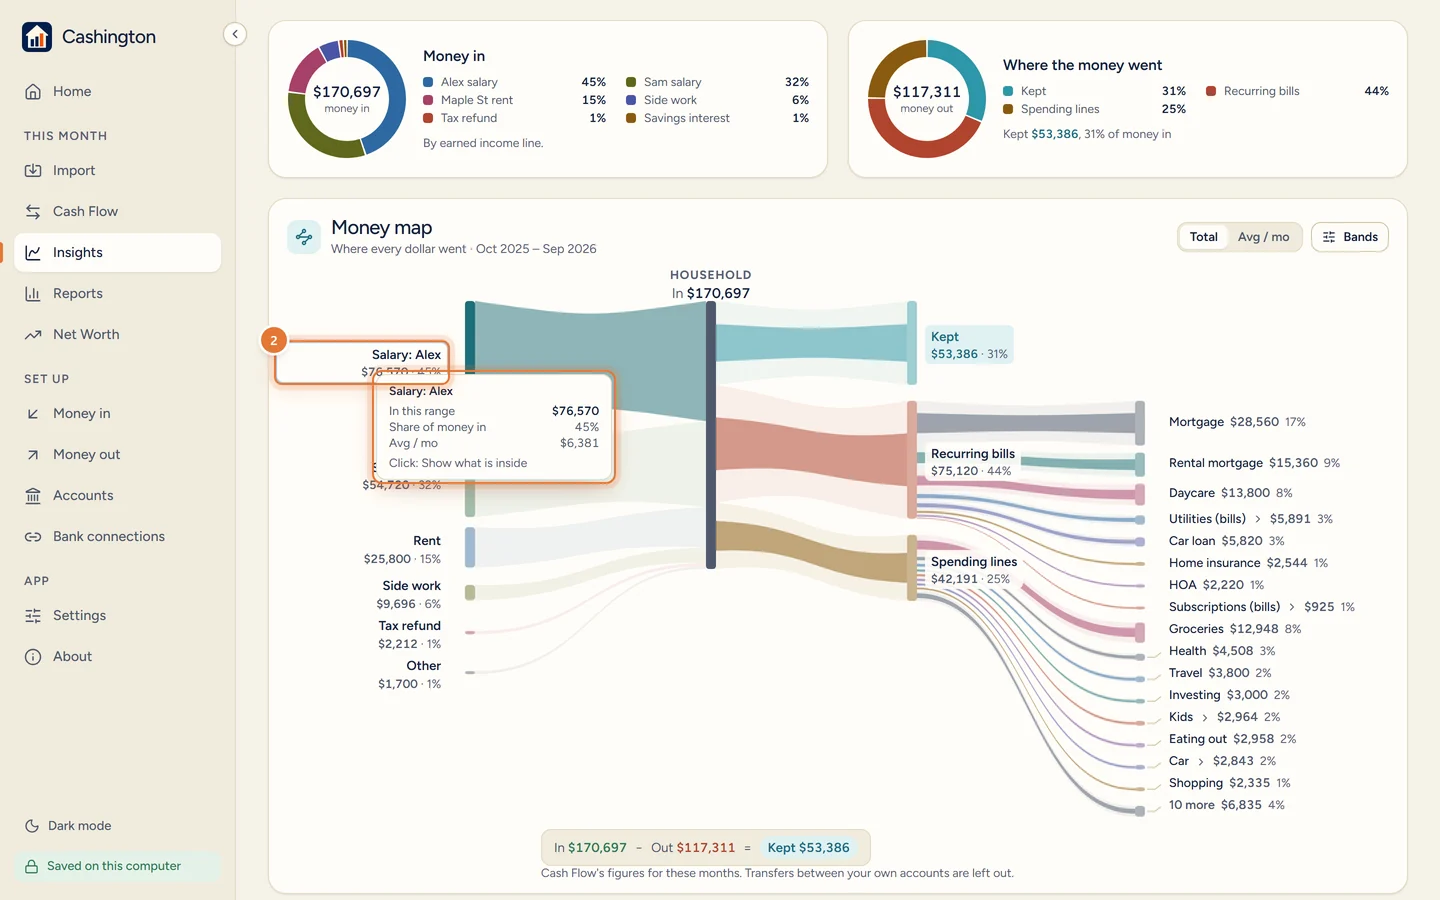
Below the rings, the Money map follows every dollar from income, through the household, to what you kept, your recurring bills and your spending lines. Hover a band or a line to light its path and see its total.
-
Open Bands
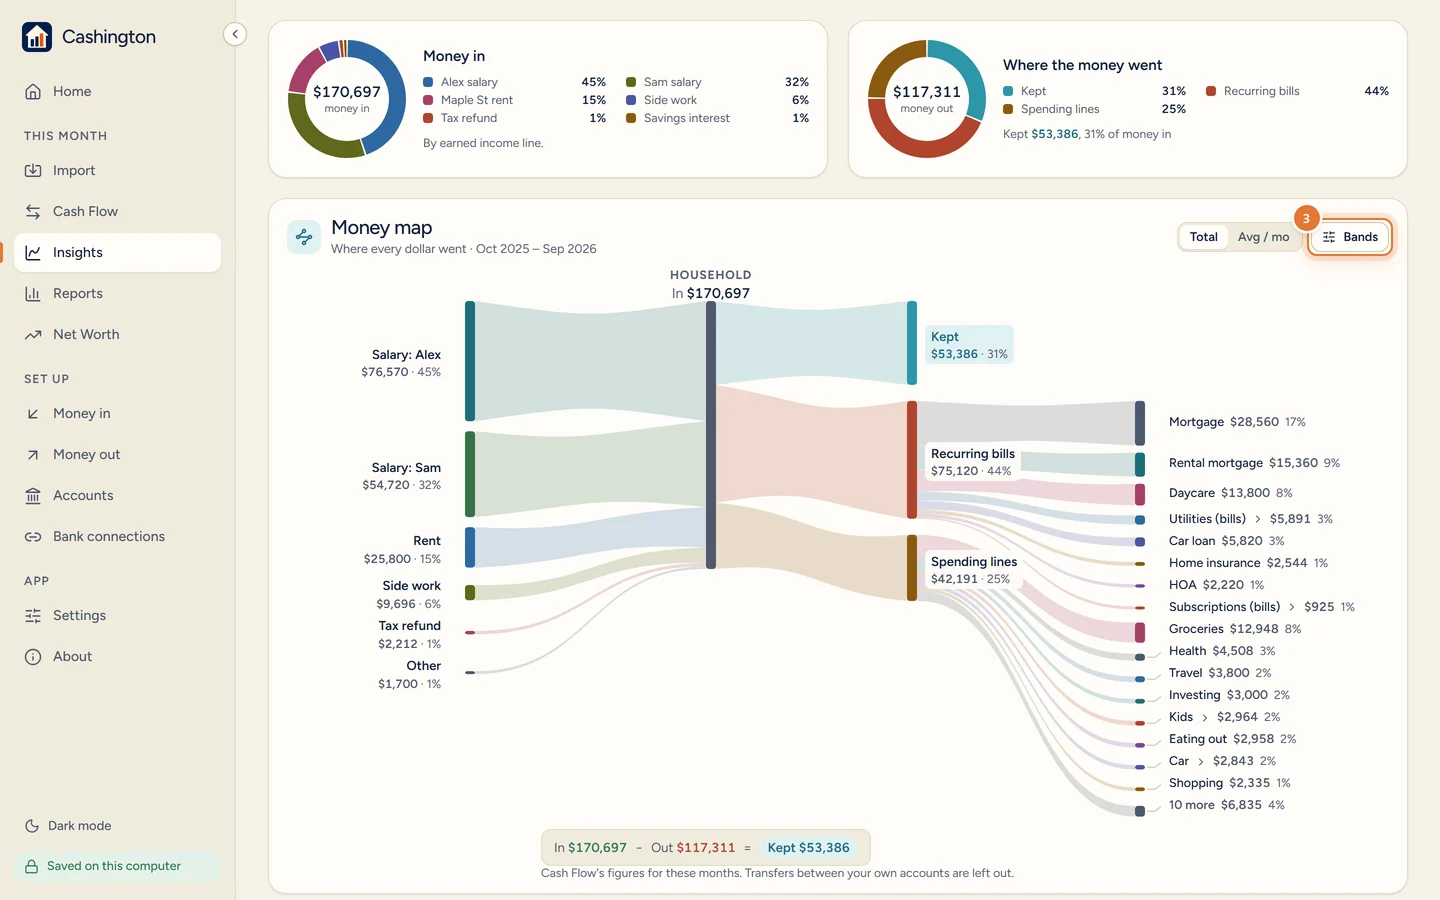
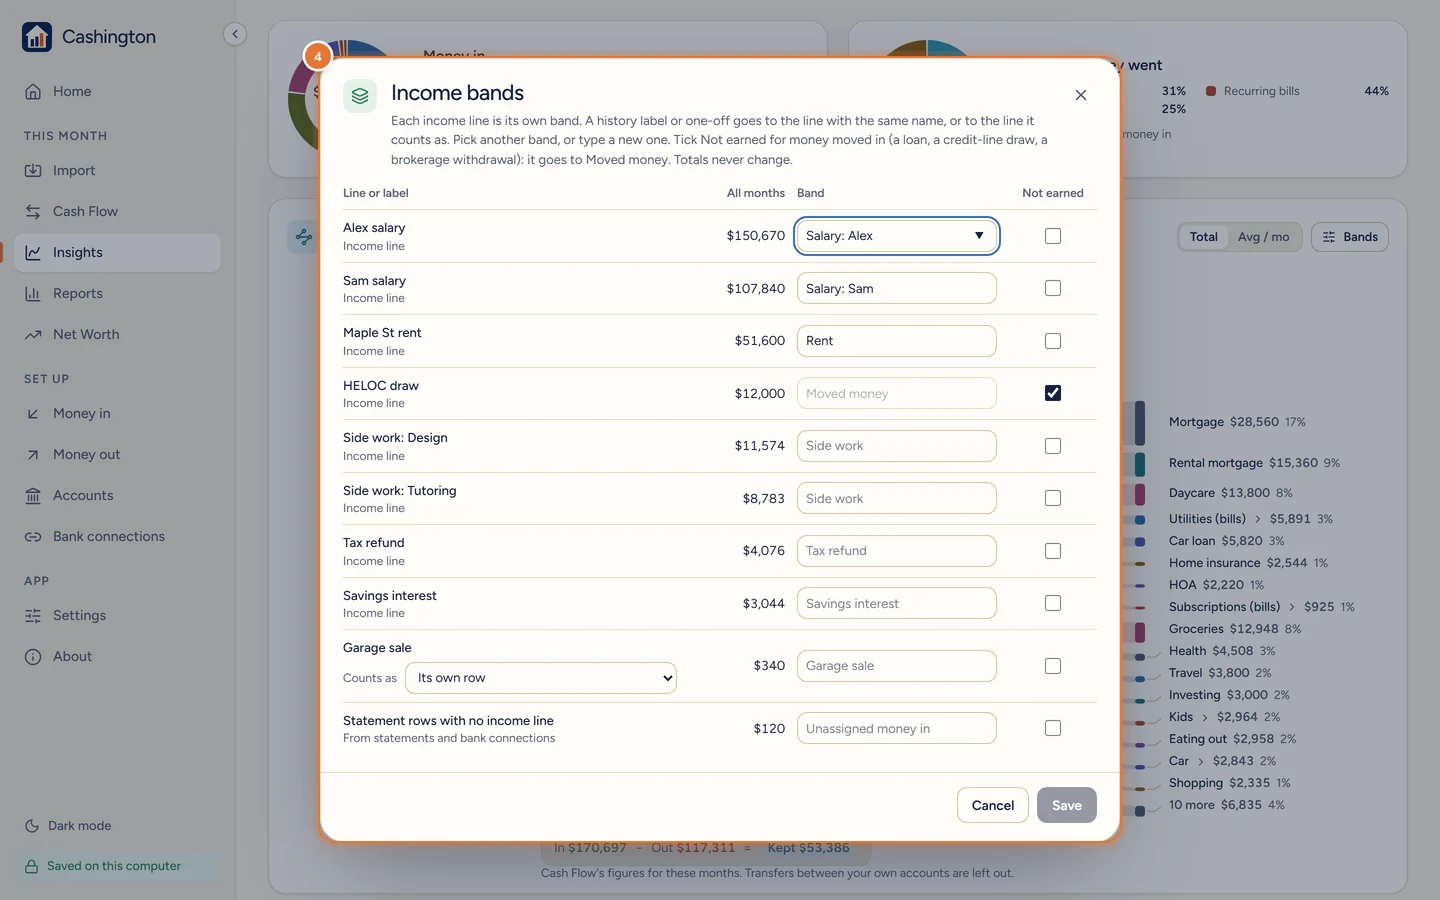
Bands decide how income is grouped on the map. Click Bands to open the editor.
-
Group your income
Give each income line or label a band, such as Salary, Rent or Side work, and mark money that isn't earned, like a loan draw, so it stays off the map unless you include moved money. Save, or Cancel to leave it.
-
Open an income band
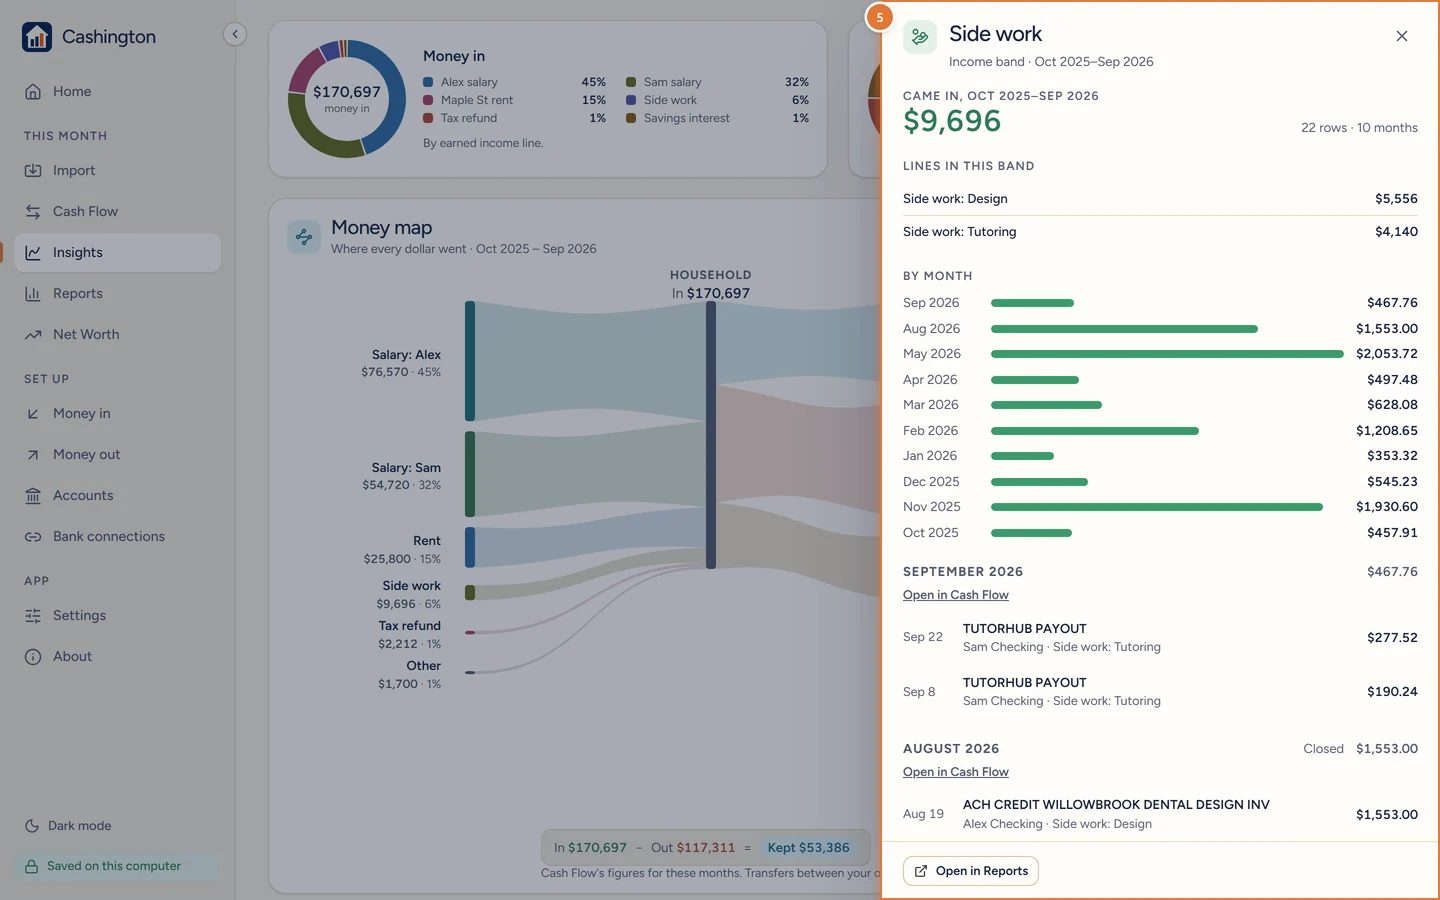
Click an income band on the left, such as Side work. A panel lists the lines inside it, the total for each month and the rows that came in, with Open in Cash Flow and Open in Reports.
-
Open a spending line
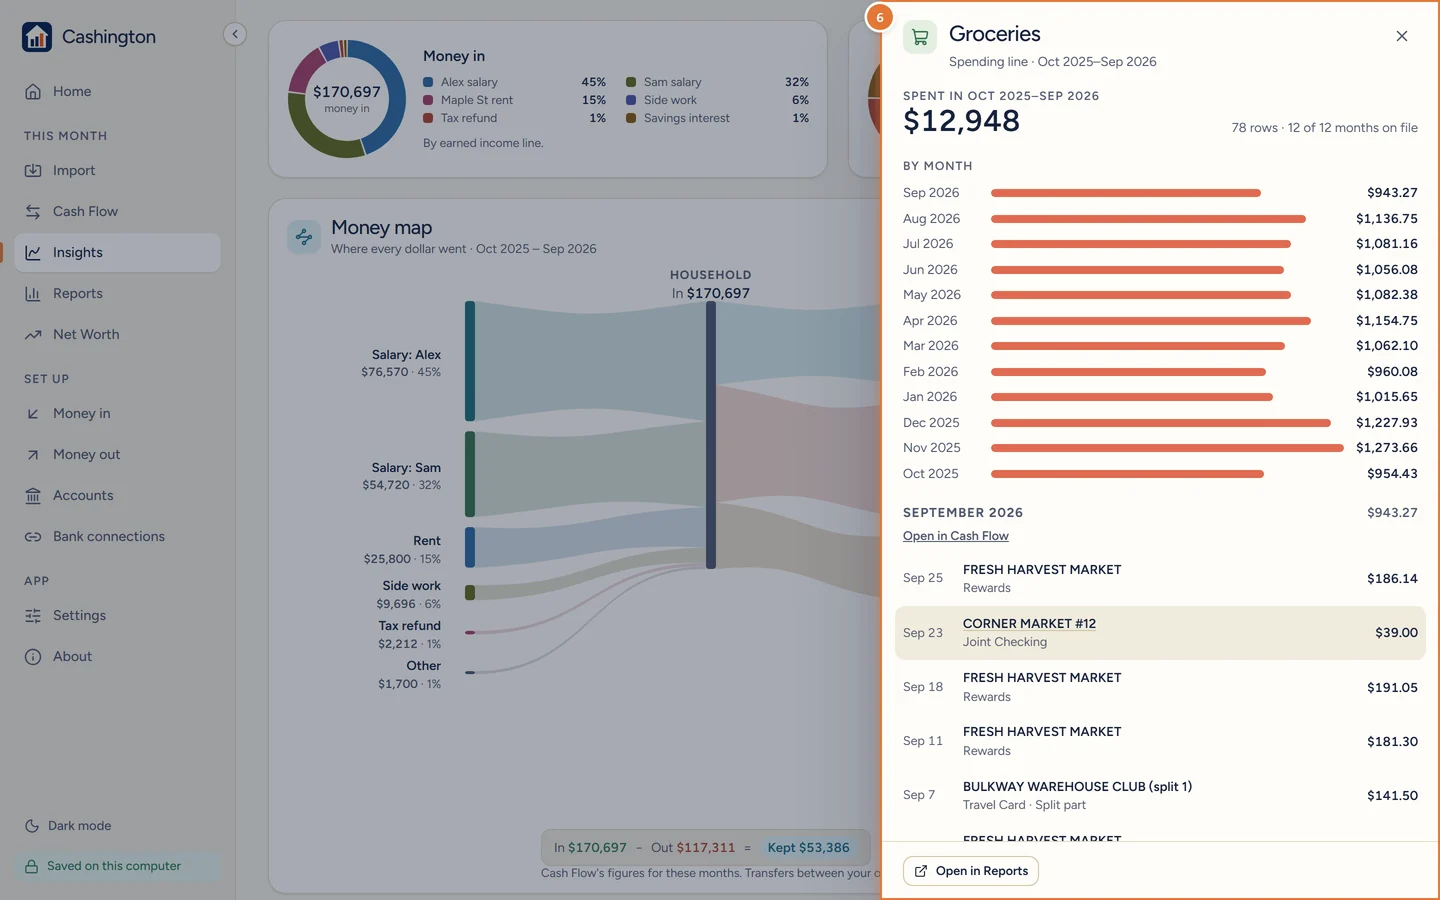
The lines and groups on the right open the same way. Here Groceries shows its spending month by month, then the rows behind each month. Click a row to open it.
-
Read the three boxes
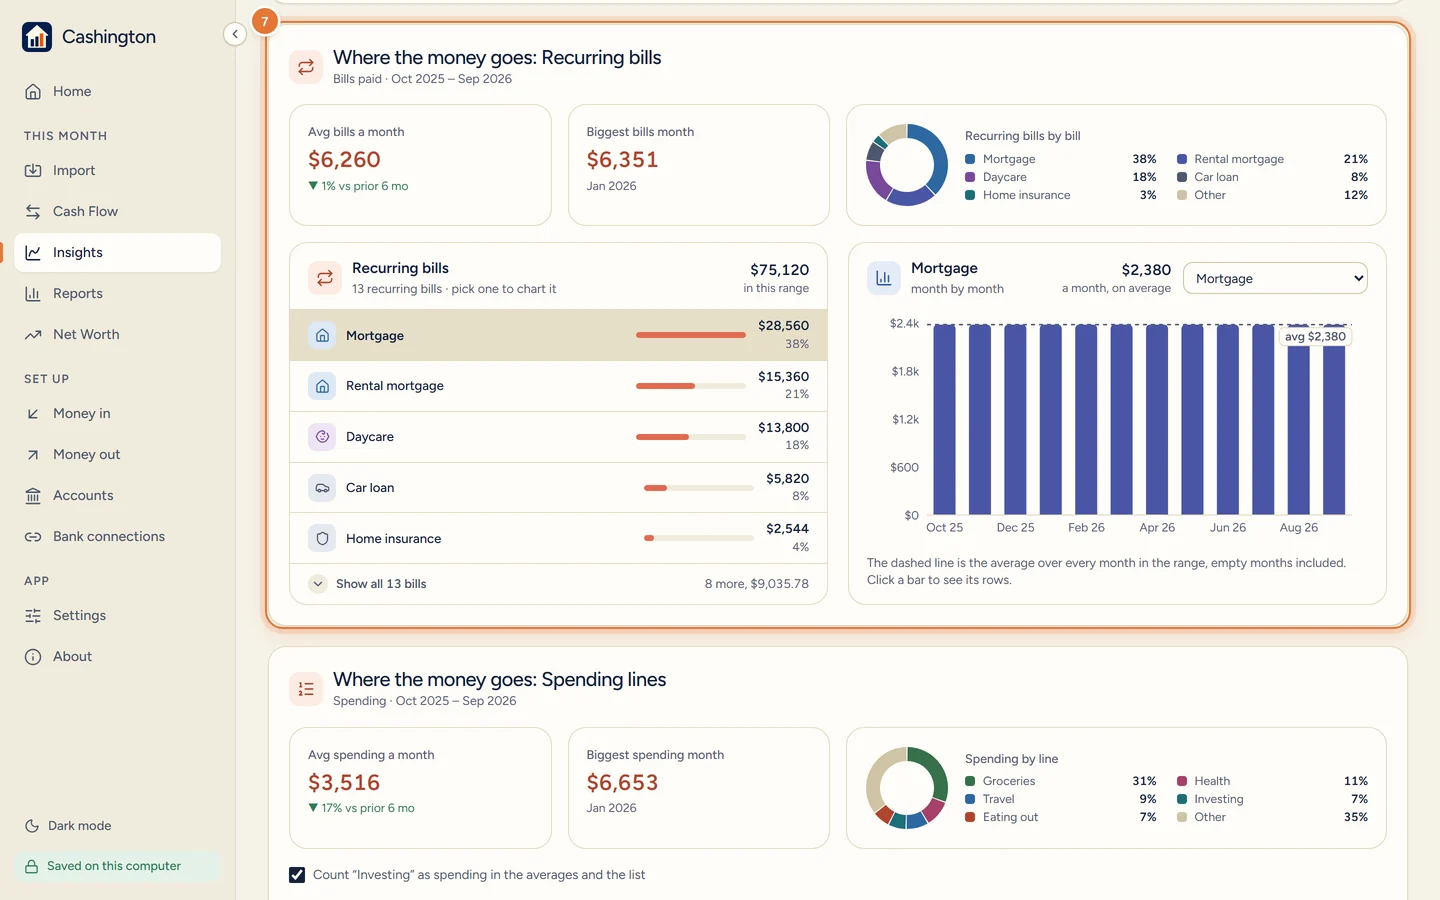
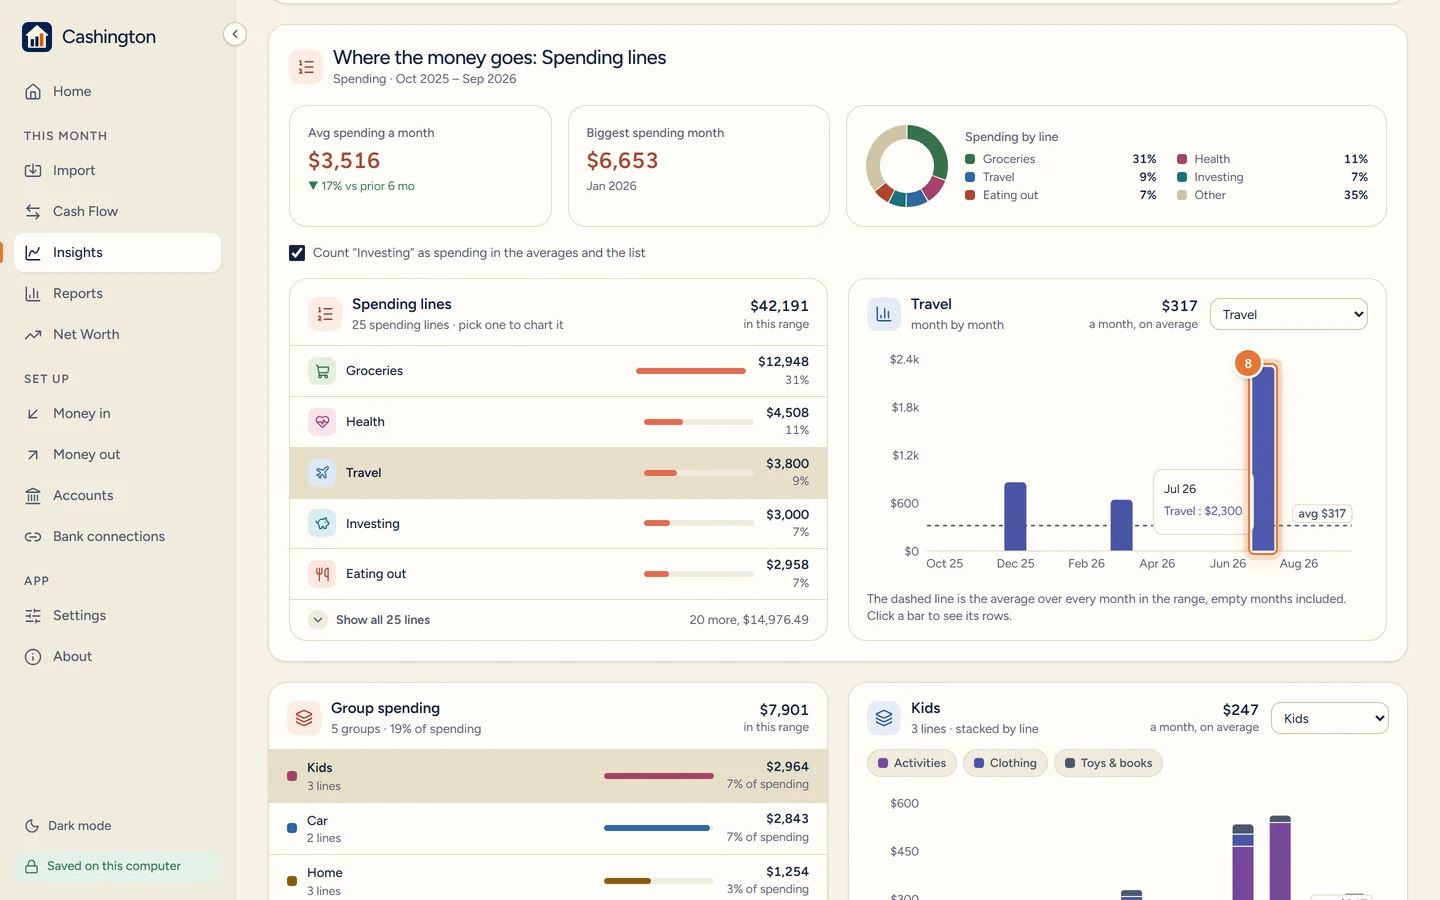
Below the map come three boxes: Where the money comes from, Where the money goes: Recurring bills, and Where the money goes: Spending lines. Each starts with the average month, the biggest month and a ring of the top five, then its list and chart. Pick a bill in the list to chart it month by month.
-
Pick a line and a bar
In Where the money goes: Spending lines, pick a line in the list; its chart shows every month. Click a bar to see the rows behind it.
-
See the rows
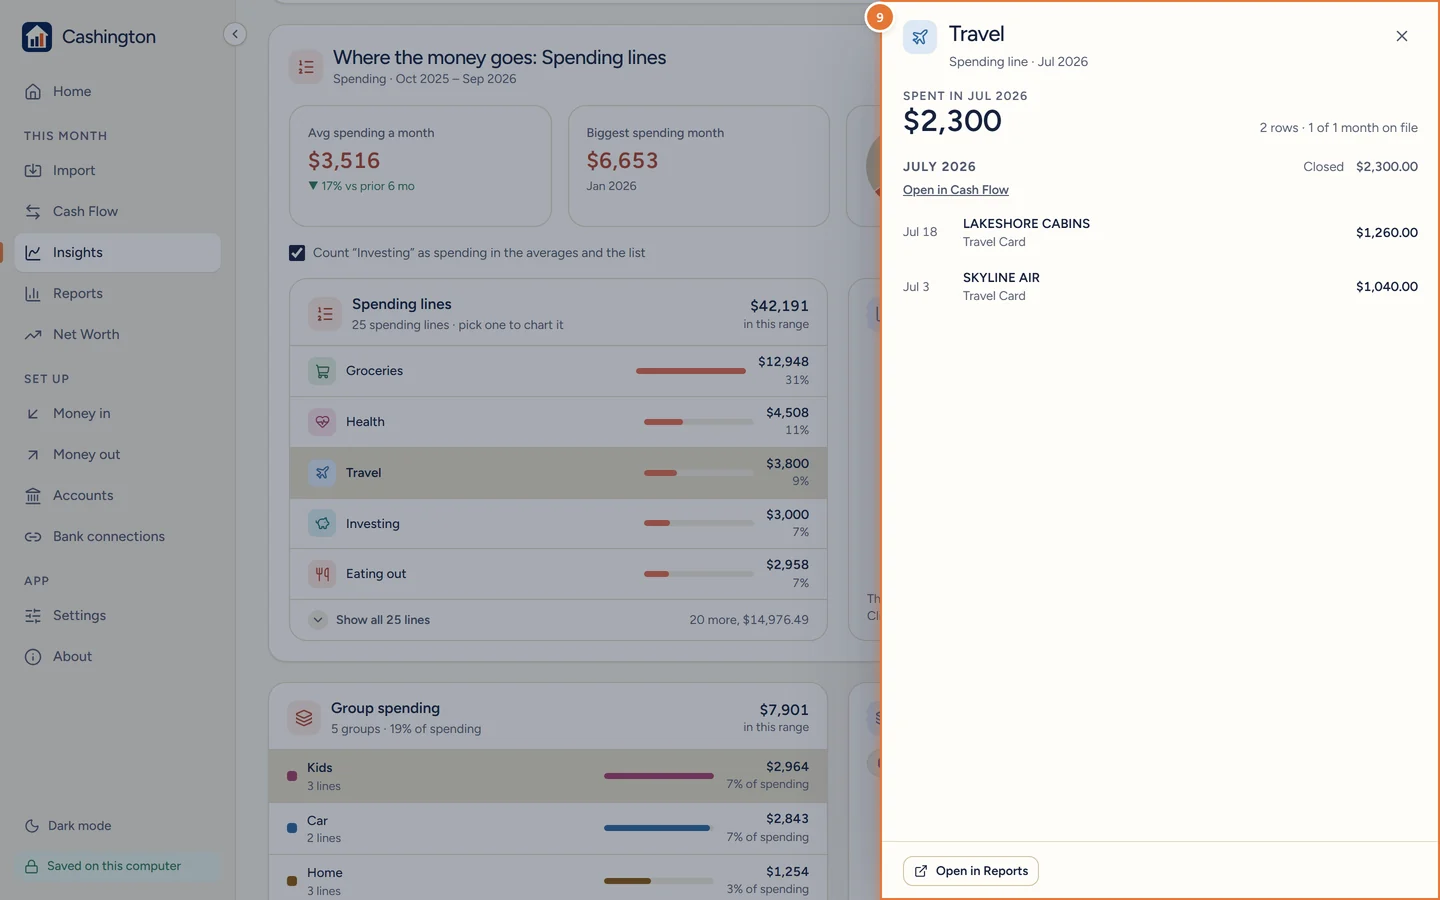
A panel lists the rows Cash Flow counted for that bar, with the month's total. Open in Reports takes them to Reports, where you can save them as a report.
-
Open a row
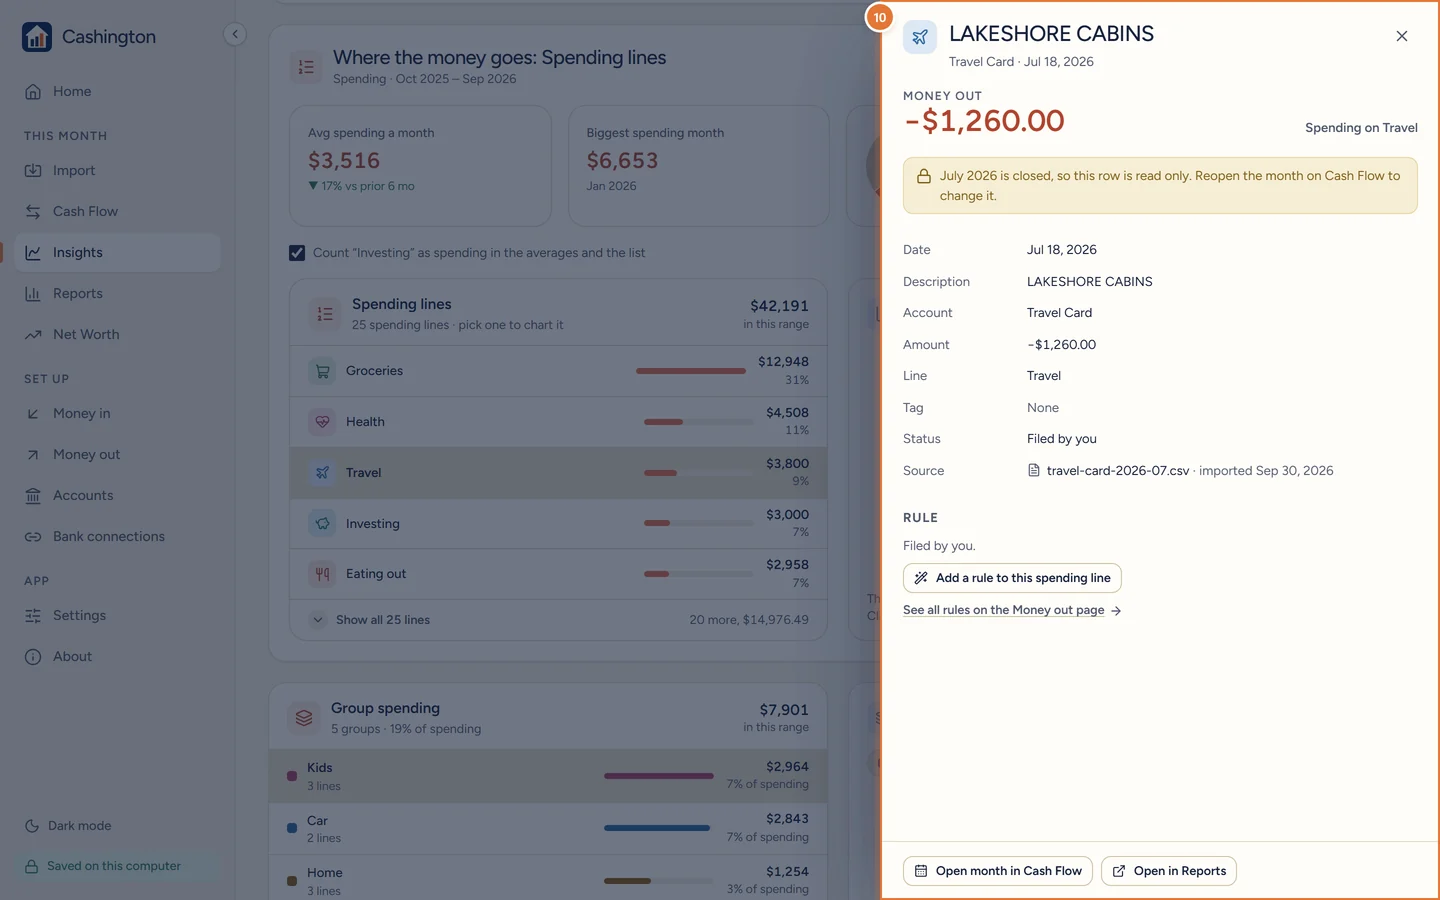
Click a row to open it in the transaction drawer: its source, line, tag and status, with actions to change them.